a.) Photobiological safety in lighting
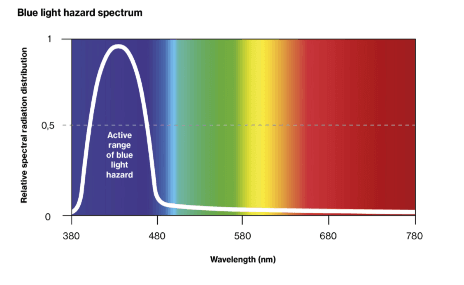
Photobiological safety refers to the potential risk of photochemical eye injury caused by electromagnetic radiation from light sources, mainly at wavelengths between 400 nm and 500nm.
(1) Legal framework
For the assessment of the photobiological safety of optical radiation emitted by lamps, there are measurement requirements and evaluation scales set out in the international standard IEC 62471:2006. In Europe this standard has been adopted with the designation EN 62471:2008, which is in accordance with European Directive 2006/25/EC.
(2) Blue light risk assessment from light sources
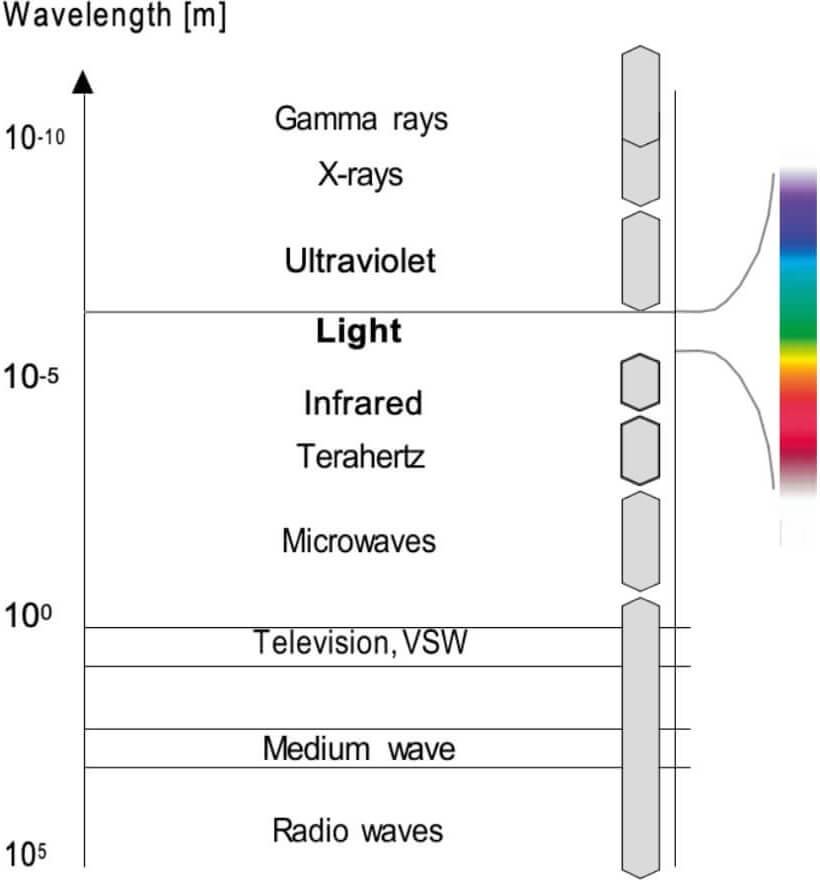
For photobiological risk assessment, it is distinguished between various wavelength ranges: ultraviolet (UV) radiation, visible radiation, and infrared (IR) radiation.
The determining factor for its classification is the depth of penetration into human tissue. For example, UV radiation is absorbed into external tissue layers. Existing risk and specified limit values vary depending on the light intensity produced. This means that the greater the risk of proximity to the light source (regardless of its size).
This is not the case for blue light risk. This type of radiation passes through the cornea of the eye and reproduces in the retina. Small light sources with high luminance pose a high local risk. In contrast, the same radiation emitted by a large light source is distributed over a wider surface area, causing a lower risk.
(3) Risk classification of lamps and luminaries
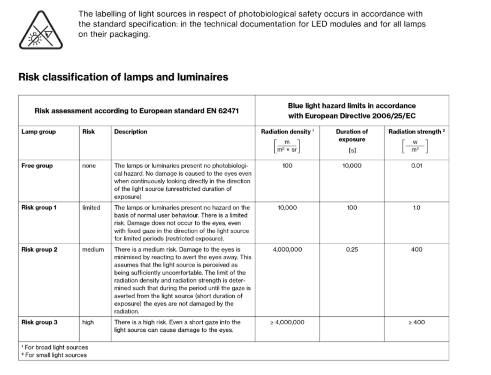
For all risk types there are measurement protocols and radiance or irradiance limit values that allow lamps to be classified into risk groups from level 0 to 3.
Description based on EN 62471.
Risk groups refer to the same distance from the eye from the light source. Because luminance cannot be increased by optical systems, reflectors, etc., the light source represents the greatest existing risk and its classification can also be adopted for the luminaire.
From risk group 2, lamps should be identified and equipped with a warning sign indicating photobiological risk and measures necessary to prevent eye injury.
a.) LED - Chromatic Homogeneity
High-quality indoor lighting solutions demand pure white places. White light with a color tint is not desirable. But since when can the human eye really distinguish 2 color coordinates from each other.
David Lewis MacAdam dealt with this issue in the 1940s. MacAdam set up an experiment in which a trained observer viewed two different colors, at a fixed luminance of about 48 cd/m2.
One of the colors (the "test" color) was fixed, but the other was adjustable by the observer, and the observer was asked to adjust that color until it matched the test color.
This match was, of course, not perfect, since the human eye, like any other instrument, has limited accuracy. It was found by MacAdam, however, that all of the matches made by the observer fell into an ellipse on the CIE 1931 chromaticity diagram.
The measurements were made at 25 points on the chromaticity diagram, and it was found that the size and orientation of the ellipses on the diagram varied widely depending on the test color.
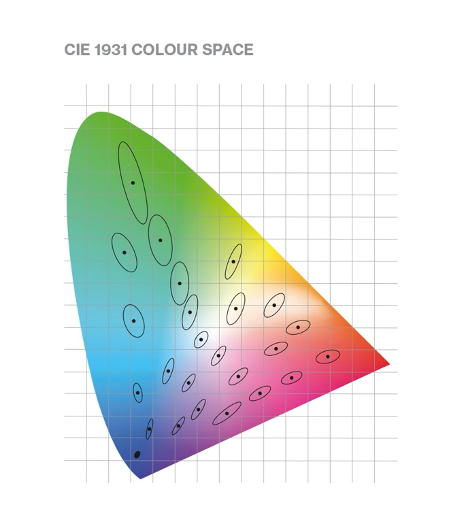
These 25 ellipses measured by MacAdam, for a particular observer, are shown on the chromaticity diagram above.
The unit accordingly is referred to as "1 Step MacAdams Ellipse”and is since then a measure of chromatic homogeneity.
In order to describe wider color gamut, the radius of the ellipse is duplicated, tripled, etc.
This results in a 2 Step (2-step), 3 Step (3-step) MacAdam ellipses,...
Because MacAdam was pronounced only over 25 color places (see chart), the unit of measure can be assigned with the Standard Deviation Color Matching (SDCM) scale for each color location in CIE 1931.
Example: A MacAdam 3 Step (3-step) ellipse can also be indicated by "≤ 3 SDCM".
b.) LED - Displacement of the color coordinates
LEDs are subjected to a shift of the color place over its lifetime.
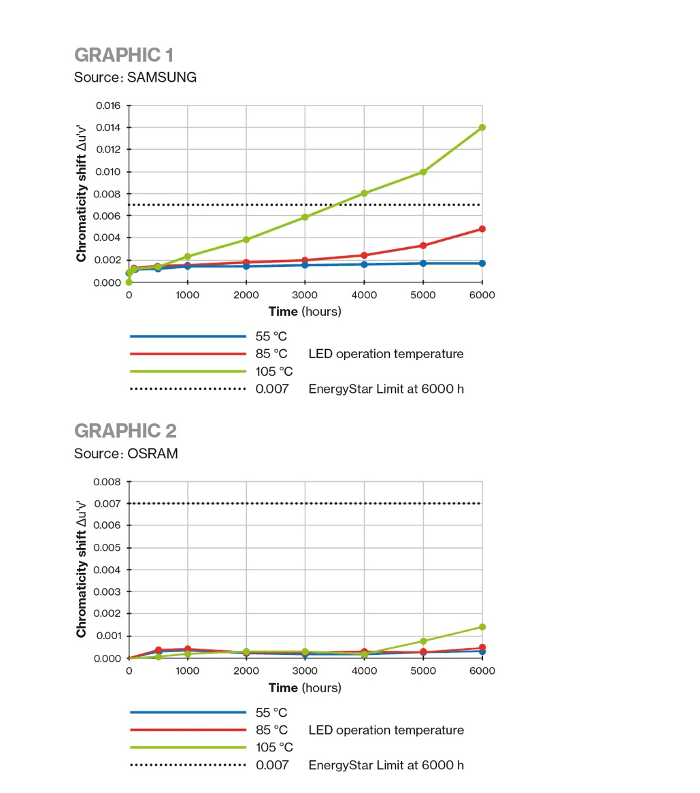
LAVOV uses for its exclusively LED luminaires that have minimal displacement of the color place in the test reports.
LEDs with values of only 0.5 SDCM after 6000 hours at 85oC correspond to a higher quality (see chart 1.) SAMSUNG; 2.) OSRAM).
The European Premium LightPro requirement and Energystar’s American requirement recommend the use of LEDs with maximum color shifting of ≤7 SDCM after 6,000 hours.
To keep the displacement of the color place as small as possible over the lifetime of 50,000 hours, a lot of knowledge is invested in thermal management. A power supply below the LED specification is, like a good cooling unit, responsible for a reduced displacement of the color place. This allows operating temperatures to be maintained around 65oC and color site displacement to be limited to 1 SDCM after 10,000 hours. The end-of-life (End) chromatic homogeneity is composed of the initial value (Initial) of the color place binning and the displacement of the color place. Any data in the data sheet relating to final color homogeneity is a sign of quality. The lack of this data highlights questionable quality. Example of a luminaire with full color place description: Initial ≤3 SDCM, directly on the BBL Final ≤4 SDCM after 10,000 hours
c.) LED - Luminous flux degradation
For the degradation of the LUMINOUS flux of the LEDs is the same as for the displacement of the color place. The higher the power supply and temperature, the more negative the effect.
LAVOV uses for its LED luminaires working conditions that have minimal luminous flux degradation in test reports.
Lifetime is expressed for the following terms “L70B10 at 50.000 hrs. “meaning “L70” the luminous flux after 50.000hrs will be a minimum of 70% and B10 that no more than 10% of the fixtures will be below that value.
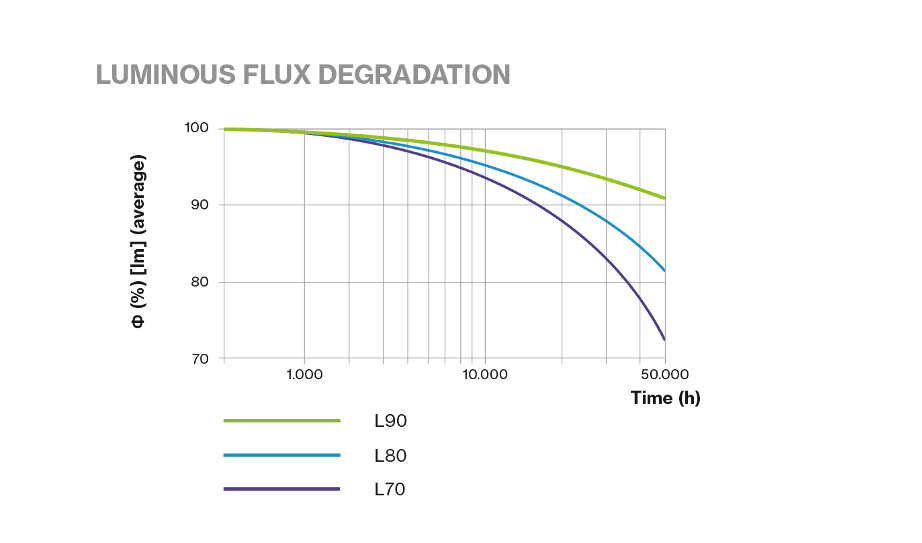
Good thermal management ensures a decrease in luminous flux to a minimum of 70%, 80% or 90% after 50,000 hours. A data in the L90 data sheet refers to the remaining luminous flux (L) of ≥ 90 % with a lifespan of 50,000 hours.
IEC 62722 states both test method and minimum required time for testing LED lifetimes. The minimum test time is 6000 hours where the luminous flux is recorded every 1000 hours. These values are extrapolated using a method stated in IES TM21.
a.) Light Color
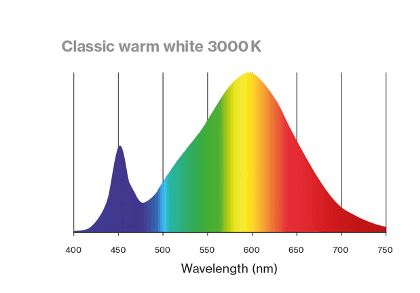
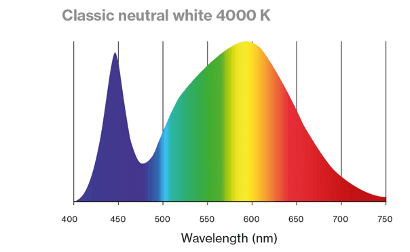
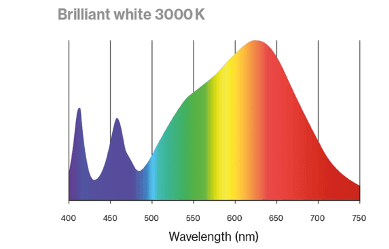
The light color describes the color appearance of the light.
|
Color temperature |
Appearance |
Association |
|
| ww (warm white) | up to 3300 K | reddish | warm |
| nw (intermediate white) | 3300–5300 K | white | neutral |
| tw (cool white) | from 5300 K | bluish | cool |
In addition to the colors of the surfaces, it is also the light color that determines a room’s basic atmosphere.
b.) CRI: Color reproduction
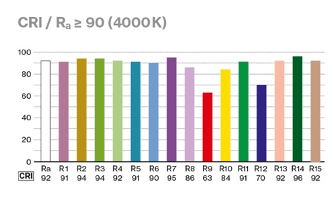
The internationally accepted Ra color reproduction index (CRI) was defined in order to assess the quality of light sources, in an objective way.
CRI compares the test light source with a reference light source by means of 15 selected test colors. The evaluation spectrum is between +100 and -60.
The more accurate the reproduction of the test color by the test light source, the greater or better the color reproduction value.
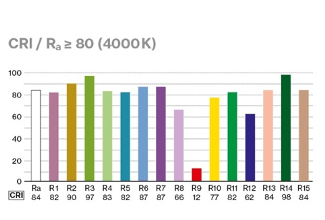
The average value of the first 8 test colors yields the reproduction rate of the color Ra.
The values of Ra are classified into:
-Moderately good color reproduction for Ra 70-80, e.g. for street lighting.
-Good color reproduction for Ra 80-90, e.g. workplace lighting.
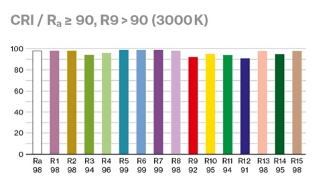
-Very good color reproduction for Ra 90-100, for example for museums and high-quality retail applications.
To further specify the quality of the color reproduction can be indicated for example in a spectrum of Ra ≥ 80 to 90 plus a characteristic Ra value with Ra (type) 85. The values obtained for the test colors R9 – R15 provide detailed information on the color reproduction of saturated colors (R9 – R12), skin color (R13), leaf green (R14) and Asian skin color tone (R15).
c.) TM-30-15: A New Method for measuring color rendition
Illumination Engineering Society’s (IES) TM-30-15 is the most recently developed method of evaluating color rendition. TM-30-15 seeks to supplant CRI as the industry standard for measuring color rendition.
What is TM-30-15?
TM-30-15 is a method of evaluating color rendition. It comprises three primary components:
-Rf- a fidelity index that is similar to the commonly used CRI.
-Rg- a gamut index that provides information about color saturation.
-Color vector graphic- a graphical representation of hue and saturation relative to a reference source.
What are the differences between TM-30-15 and CRI?
There are a few important differences.
First, CRI provides information only about fidelity, i.e., the accurate rendition of color such that objects appear similar to how they would under familiar reference illuminants such as daylight and incandescent light.
However, CRI doesn’t provide any information on saturation. The picture below shows two images with the same CRI and different levels of saturation. While the images obviously look very different because of different saturation levels, CRI doesn’t provide a mechanism of describing these differences. TM-30-15 uses the Gamut Index (Rg) to describe differences in saturation.

Second, whereas CRI uses only eight color samples to determine fidelity, the TM-30-15 uses 99 color samples. A lighting manufacturer could ‘game’ the CRI system by ensuring that certain peaks of the light source spectra matched one or a few of the eight color samples used in calculating CRI and thus achieve an artificially high CRI value. Such an artificially high CRI value would result in a lower TM-30-15 value since TM-30-15 has 99 color samples. After all, matching spectrum peaks to 99 color samples is very difficult!
TM-30-15 seems to provide more information than CRI. Which TM-30-15 values are ideal for my application?
The answer is, “it depends.” Similar to CRI, TM-30-15 is not prescriptive in defining metrics that would be ideal for a given application. Instead, it is a procedure for calculating and communicating color rendition.
The best way to ensure a light source works well in an application is to test it in the application. As an example, look at the picture below:
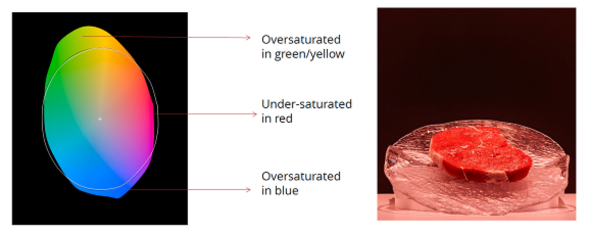
The TM-30-15 color vector graphic on the left shows the relative saturation of different hues of the COB Décor Series Food, Meat & Deli LED, which is shown illuminating a meat sample on the right. The Décor Meat product looks ‘reddish’ to the eye and was specifically designed to be used by the food, restaurant and grocery industry. However, the color vector graphic indicates that the Décor Meat spectrum is under-saturated in red and over-saturated in green and blue relative to the reference source—the very opposite of how the spectrum looks like to the human eye.
This is just an example of why TM-30-15 and CRI can’t predict values that would be ideal for a particular application. In addition, the TM-30-15 applies only to ‘nominally white’ sources and doesn’t work well with specialty color points such as the Décor Food, Meat& Deli.
No single method can specify the optimum light source for an application and experimentation is the best way to identify the optimum light source. In addition, when updated, the IES DG-1 standard will include some design guidance.
d.) Color coordinates
The color location of a light source is represented in the 1931 CIE Standard Color System. Each light source can be uniquely indicated with x and y coordinates. On the curved outer contour, the spectral color, are applied the wavelengths visible to the human eye. The lower border consists of the purple line, which represents the limit of visible light with invisible ultraviolet and infrared radiation.
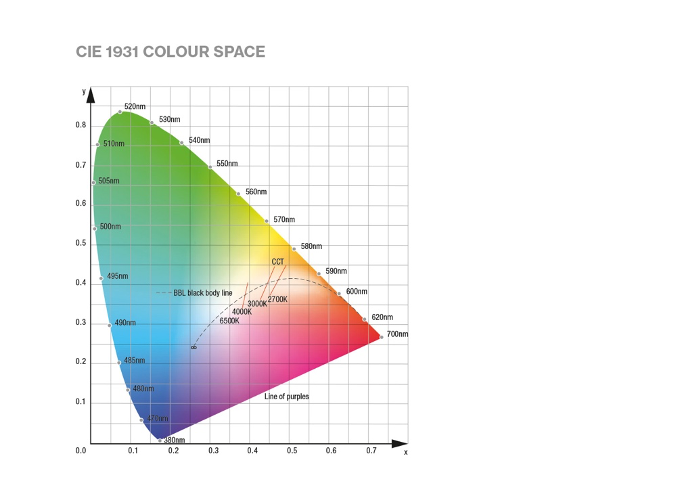
The white light area is in the center of the diagram and is marked by the Black Body Line (BBL).
All the colored places found in the BBL are pure white and result from a mixture of a large number of visible wavelengths.
The color places above the BBL are distinguished by the mixing ratio of the wavelengths. In case there is a majority presence of red wavelengths we talk about a warm white light. Cold white light, on the other hand, has mostly blue wavelengths. On the BBL are the color places of color temperatures from approximately 1000 K (Kelvin) to approximately 40,000 K.
With ≤ 3500 K warm white light sources are designated. From 3500 K to 5000 K neutral white is designated, >5000 K are cold white light sources.
If a place of the color of a white light source is not on the BBL, this is due to an excess of a colored wavelength. Depending on the color, yellowish, greenish, bluish or pinkish is spoken. The BBL is cut by the CCT lines. These lines are formed by places of color of the same color temperature, regardless of whether they are pure white, yellowish or pinkish.
e.) Binning
Binning indicates a sort or classification of brightness, CRI value, direct stress, and color location.
Color Place Binning: The binning of the color place indicates the area of the color place where all LEDs are located at the time of delivery. This is indicated by "Initial".
The area around the BBL line is divided according to ANSI C78.377A between 2600 K and 7000 K in 8 areas (see chart). The separation lines between the areas are the CCT lines, as lines of identical color temperature.
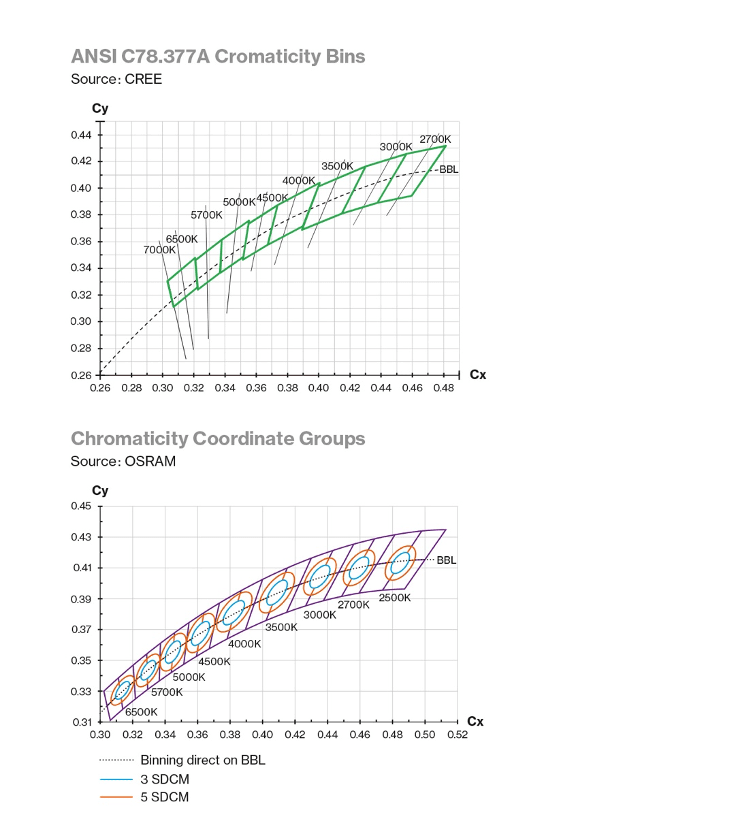
The 8 areas comprise color temperatures around 2700 K, 3000 K, 3500 K, 4000 K, 4500 K, 5000 K, 5700 K and 6500 K. Because each of the colored places is well distinguishable within this approximate distribution, only LEDs of smaller colored areas are mounted on luminaires.
At best, all color places come from an ellipse-shaped area that is located right in the center of the ANSI rectangle over the BBL.
The size of the ellipse is a quality criterion. The smaller the ellipse or the lower the values indicated with the SDCM, the more uniform the appearance of the light color.
With ≤ 3 SDCM or 3 Step MacAdam, nuances cannot be distinguished between each of the luminaires. In the data sheets of the luminaires "Initial ≤3 SDCM" it is a very good value. However, this data is often missing entirely, indicating a questionable quality of this luminaire.
A.)
In order to perform correctly visual tasks in illuminated areas, there should not be any great differences in brightness so the uniformity should not fall below UO = Emin/Ē.
B.)
Glare & glare limitation
1.) Direct glare

Cause
Luminaires without glare control
Very bright surfaces
Effect
Loss of concentration
More frequent mistakes
Fatigue
Solution
Luminaires with limited luminance levels
Blinds on windows
C.)
Glare evaluation
The glare of all luminaires that are in the room can be evaluated with the UGR method, as it is specified in the standard EN 12464-1 “Lighting of indoor workplaces”.
LED luminaires with very bright light points, which can be perceived individually, are crucial.
1.) The UGR method
The standardized UGR method (unified glare rating) is used to assess (psychological) glare.
The UGR value is calculated with a formula.

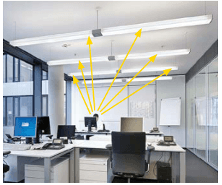
This takes into account all of the luminaires in the system that contribute to the impression of glare. The UGR values for luminaires are determined using the table method pursuant to CIE 117.
The UGR tables are available for each luminaire via the respective photometric data sheet.
The values are hereby used for a classification on a glare level. A comparison of individual values does not allow any statement.
Example: 18.5 is≤ 19 (level) but not better than 19.0 (same glare level ≤ 19).
UGR limits (UGRL) that must not be exceeded depending on the visual task:
≤ 16 Technical drawing
≤ 19 Reading, writing, training, meetings, computer-based work
≤ 22 Craft and light industries
≤ 25 Heavy industry
≤ 28 Railway platforms, foyers
The UGR limits are specified in the EN 12464 standard for activities and visual task.
2.) Illuminance levels on ceilings and walls
Unlit ceilings and walls create an unpleasant room impression. Bright surfaces, however, pleasantly enhance the room climate.
The EN 12464 standard therefore requires an illuminance level of at least 30 lx or 50 lx* on ceilings and at least 50 lx or 75 lx* on walls. In fact, these levels ought to be significantly exceeded and should be at least 175 lx on walls to get a good result.
* in offices, classrooms, hospitals

3.) Spatial illumination
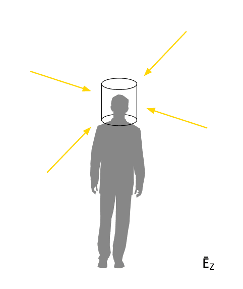
In order to enhance people’s and objects’ recognizability in a room, basic requirements are placed on cylindrical illuminance ĒZ and modelling.
Hence, ĒZ should be as high as 150 lx in rooms used for communication. Modelling is the ratio between cylindrical and horizontal illuminance at a specific point and should be between 0.3 and 0.6.
1.Illuminance
As we have said before Illuminance is calculated as the quantity of luminous flux falling on a particular surface. Relevant standards specify the required illuminance (e.g. EN 12464 “Lighting of indoor workplaces”).
a.) Illuminance maintenance value Ēm
Value below which the illuminance level must not fall in the visual task area.
b.) Visual task area
Illuminance levels are specified for specific visual tasks and are designed for the area in which these may be developed. If the exact location where the task will take place is unknown, the room as a whole or a defined area of the workstation is used for specification purposes.
The visual task area can be a horizontal, vertical or inclined plane.
c.) Area immediately surrounding the visual task area
The area surrounding the place where the task is going to be developed can have a one level lower illuminance than in the visual task area (e.g. 300 lx to 500 lx).
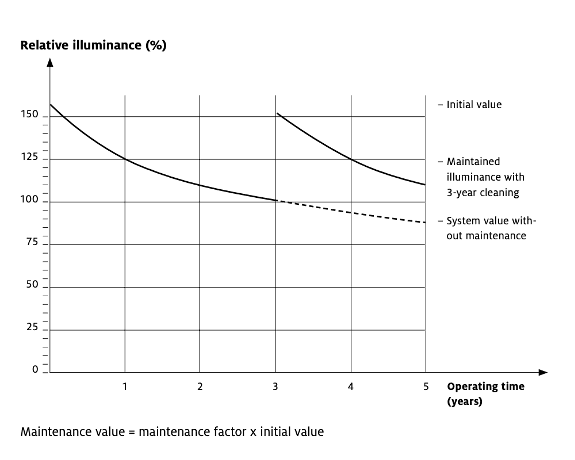
d.) Maintenance factor
A maintenance factor (MF) is applied to a lighting design to take into account a reduction in the output of the luminaires used within any lighting installation and ensure that the correct level of light will be delivered at the 'end of life'.
The maintenance factor can be determined individually and takes the installation’s reduction in luminous flux caused by soiling and ageing of lamps, luminaires and room surfaces into account.
The maintenance factor (MF) of a lighting installation consists is calculated by using 4 other factors:
-Luminaire Maintenance Factor (LMF)
-On-site Maintenance Factor (RSMF)
-Lamp Luminous Flux Maintenance Factor (LLMF)
-Lamp Survival Factor (LSF)
MF = LMF × RSMF × LLMF × LSF
A). Basic parameters used in lighting
1.Luminous Flux
The luminous flux is the amount of energy per second in the form of light emitted by a light source. It is measured in lm. It is then a measure of the light power emitted by a light source.
Abbreviation: Φ (phi)
The measure unit is lm (lumen).
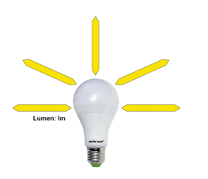
The luminous intensity describes the quantity of light that is radiated in a particular direction. This is a useful measurement for directing lighting elements such as reflectors or lenses. Luminous intensity distribution curve (LDC) shows the spatial distribution of luminous intensity.
Abbreviation: I
The measure unit is cd (candela).
3.Illuminance
Illuminance is calculated as the quantity of luminous flux falling on a particular surface. Relevant standards specify the required illuminance (e.g. EN 12464 “Lighting of indoor workplaces”).
Illuminance E(lx) = luminous flux (lm)/area (m2)
Abbreviation: E
Measure unit: lx (Lux)
4.Luminance
Luminance is the only basic lighting parameter that is perceived by the eye.
It describes on the one hand a light source’s impression of brightness, and on the other, a surface and therefore depends to a large extent on the degree of reflection (color and surface).
Abbreviation: L Unit: cd/m2
A.Human centric lighting
Human Centric Lighting puts people benefits in the center of the lighting projects.
With the right light at the right time human centric lighting (HCL) creates a working environment that simulates the changes in natural daylight with its visual, biological and emotional effects. To achieve this, the luminaires are controlled by an intelligent control system with appropriate light profiles.
Through color temperatures and illuminance levels, human centric lighting (HCL) can simulate the course of natural daylight in such a way that it provides positive support for the human circadian rhythm (our “inner clock”). A neutral or cold white light color, for example, can energize in the morning. Warm white light is relaxing and ideal for the evening. HCL supports health, well-being and performance.
Light has a triple effect:
1.Light for visual functions
-Illumination of task area in conformity with relevant standards
-Glare-free and convenient
2.Light for emotional perception
-Lighting enhancing architecture
-Creating scenes and effects
3.Light creating biological effects
-Supporting people’s circadian rhythm
-Stimulating or relaxing

B.Quality of lighting
The evolution of lighting technology has brought about a change in criteria regarding what is considered correct lighting.
With a conventional approach to lighting, we have to consider getting a sufficient illumination level with a harmonious brightness distribution. Also glare limitation and the avoidance of reflections are important attributes in order to provide a comfortable lighting solution. With these characteristics we can get a good space modelling. Another important criterion is related with color quality and color rendering. Use the right light color and with the correct CRI will provide a better lighting solution
But today’s lighting designers have to face new challenges. The HCL is one of the new trends and thus lighting projects have to consider changing lighting situations due to personal control. At the same time energy efficiency is a must as well as the integration of day light into the equation. On top of that lighting designers consider light as part of the interior design attributes.
Let’s analyze some of the main lighting concepts and the right values for a correct illumination.
